

March 2025
ICE Futures Singapore Monthly Report
TRADDICTIV® tradewithufos.com
MACRO COMMENTARY
The MINI U.S. DOLLAR INDEX® FUTURES (SDX) extended its downward trajectory in March after reaching a monthly high of 107.24 to close at 103.92 with a loss of 3.09%, the worst monthly performance since November 2022. The decline reflected a broader cooling in demand for the U.S. Dollar, driven by growing market unease over the potential economic fallout from proposed tariffs and their effects on domestic and global economic activity, which could potentially stoke inflationary pressures.
- Nonfarm Payrolls (NFP) for February fell short of market expectations with an increase of 151,000 new jobs compared to the anticipated 160,000 and up from January’s downwardly revised total of 125,000 (initially reported as 143,000). The unemployment rate edged higher to 4.1% in February, rising from 4.0% in January, while annual wage inflation rose to 4.0%, a slight decrease from the 4.1% reported the prior month. The SDX closed at 103.75, with a 0.32% loss on the day.
- Annual Core Inflation, excluding food and energy, surprised the markets after easing to a rate of 3.1% for the 12 months ending February, below market expectations of 3.2% and 3.3% reported for January. Additionally, the Consumer Price Index (CPI) for the same 12-month period also decreased from 3.0% to 2.8%. These inflation reports led to the SDX closing the day with a gain of 0.10% at 103.58.
- The Federal Open Market Committee (FOMC) held the federal funds rate steady at 4.25% to 4.50% during its March meeting, in line with market expectations. This move signaled the Fed’s cautious stance as it continued to assess a mixed economic picture, balancing stubborn inflation pressures with a steady labor market. Policymakers appeared to be taking a measured wait-and-see approach. The SDX closed with a gain of 0.19% at 103.18.
The MINI BRENT CRUDE FUTURES (BM) twice found support above the $69 level before steadily climbing back to $74. Ultimately, price closed at $74.77, marking a 2.7% increase from the previous month's close.
- U.S. President Donald Trump issued a warning about "secondary tariffs" on countries purchasing oil from Russia and Venezuela, particularly targeting buyers like China. This aggressive trade stance sparked fears of supply disruptions, injecting uncertainty into the markets and adding upward pressure to prices.
- Meanwhile, the OPEC+ alliance, which includes major producers such as Saudi Arabia, Russia, Iraq, and the United Arab Emirates, continued navigating a delicate balancing act. In March, they reaffirmed their commitment to stabilizing the market through controlled output, even as the global economy showed signs of both recovery and fragility. However, starting April 1st, OPEC+ initiated a phased rollback of their previous 2.2 million barrels per day cut, increasing output by 138,000 barrels per day each month, aiming for full restoration by September 2026. This decision, led by optimism in demand recovery, particularly from Asia, also underscored their readiness to adjust if market conditions shift.
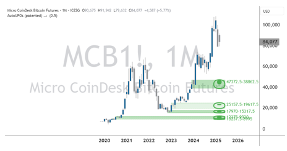
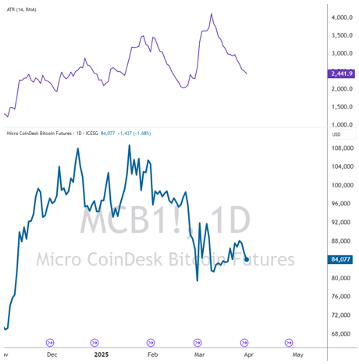
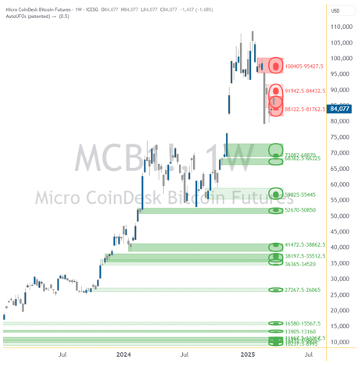
The MICRO COINDESK BITCOIN FUTURES (MCB) briefly climbed to $92,000 in the first week of the month after slipping below the former $93,000 support level, which had turned into resistance. The price later retreated toward $80,000, ending the month at $84,077- up 5.8% from the prior month. Risk-based assets continued to reflect the economic uncertainty carried over from the previous month.
- Amid persistent market uncertainty, a number of spot-bitcoin exchange-traded funds (ETFs) were introduced. Leading the wave was BlackRock’s iShares Bitcoin ETP (exchange-traded product) (IB1T), which made its debut on major European exchanges, including those in Paris, Amsterdam, and Frankfurt. Also noteworthy was the launch the Calamos principal-protected bitcoin ETFs andthe Calamos Bitcoin 80 Series Structured Alt Protection ETF® – April (CBTA) Designed with capital preservation in mind, these products cater to risk-conscious investors and underscore the growing sophistication and mainstream accessibility of crypto-related financial instruments.
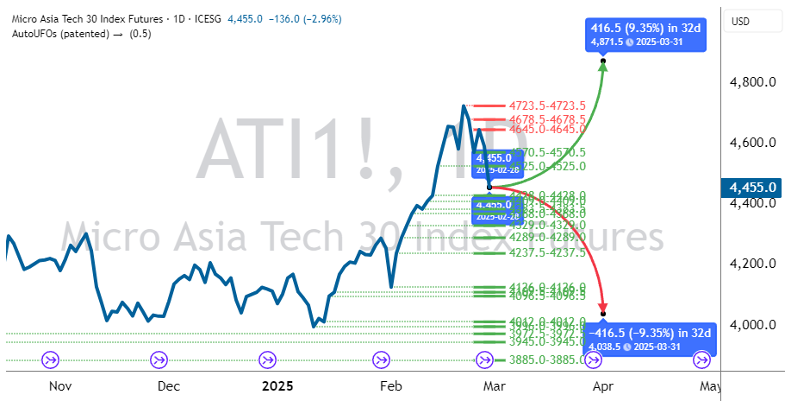
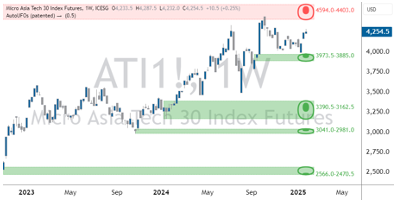
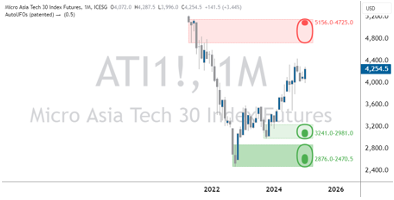
The MICRO ASIA TECH 30 INDEX FUTURES (ATI) reversed its February gains, closing at $4,251, reflecting a 4.6% decline from the previous month. Technology stocks globally faced price losses in the first quarter, as investors took profits amid continued uncertainty following President Trump’s tariff announcements.
- Taiwanese stocks struggled across the board. ASE Technology and Hon Hai posted steep drops of 16.40% and 16.10%, respectively. TSMC fell 12.50% amid concerns over global chip orders, while Delta, Quanta, and MediaTek also declined between 8% and 10%, capping off a difficult month for the sector.
- Japanese stocks were broadly negative. Only Fujitsu and Sony posted gains, rising 2.50% and 0.70% respectively, supported by stable earnings in IT and entertainment. The rest of the segment declined sharply, with DISCO and Advantest down more than 20%, and Renesas losing 19.40%, highlighting pressure on the chip equipment space. Other notable names such as Keyence, Lasertec, Murata, Canon, Nintendo, and Tokyo Electron also recorded losses ranging from 5% to 10%, as global demand concerns weighed heavily.
- Chinese stocks showed relative strength this month. Kuaishou led with a solid 7.40% gain, while Baidu advanced 7.70% on optimism around its AI developments. NetEase rose 2.10%, and both Alibaba and JD.com saw slight gains of 0.40% and 0.10%, respectively. Meanwhile, Xiaomi fell 5.10% and Meituan declined 3.80%, possibly due to concerns over domestic consumer demand.
- Performance in Korean stocks was mixed. Samsung Electronics gained 6.10% amid signs of recovery in chip demand, while SK Hynix edged up 0.30%. In contrast, LG Energy Solution dropped 5.00%, potentially reflecting reduced investor appetite for EV-related stocks.
- In Australia, Wisetech Global experienced a sharp 9.20% decline, reflecting weaker sentiment around tech logistics as investor caution grew.
MINI U.S. DOLLAR INDEX® FUTURES
SYMBOL: SDX
CONDITIONS:
UPCOMING HIGH IMPACT EVENTS:
- Thr 10 Apr Consumer Price Index (Mar)
- Wed 16 Apr Retail Sales (Mar)
- Wed 23 Apr S&P Global Manufacturing & Services PMI
- Wed 30 Apr GDP Annualized (Q1) PREL
MARKET COMMENTARY
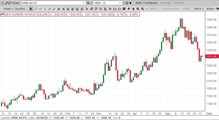
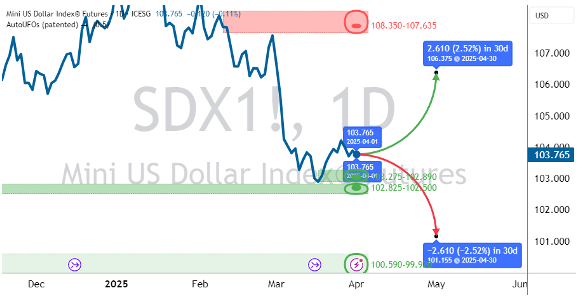
The SDX experienced significant volatility throughout March. Trading began on March 3rd, where the SDX briefly rallied to a high of 107.24, retesting the midpoint of the daily Bollinger Bands and then reversing sharply as concerns over proposed U.S. tariffs and weaker macroeconomic data weighed on sentiment, allowing the bears to return. The SDX broke below a daily support area that had held in the prior month, trading below the lower boundary of the daily Bollinger Bands by March 5th. This bearish momentum gathered pace throughout the week, driven by tariff concerns and negative data, as Nonfarm Payrolls missed expectations and January’s data was downwardly revised. The SDX closed the week with a loss of 3.25%, the sharpest decline since November 2022.
The following week, the SDX experienced a gradual rise as the market reacted to softer-than-expected inflation data and countered a significant decline in consumer sentiment. With the increased demand for the U.S. Dollar, the SDX closed with a gain of 0.40% at 103.99. In the third week of March, after initially gapping down, the SDX reached a support area between 103.15 to 102.85, lifting on March 20th as the market digested the previous day's Fed announcement, which held interest rates at 4.25% to 4.50%. The SDX closed the week at 103.80, up 0.46%.
The final week of March saw the SDX reach a high of 104.25 before closing lower as markets reacted to mixed economic signals and ongoing uncertainty over U.S. trade policy. While there were attempts to recover and trade above the midpoint of the daily Bollinger Bands on March 27th, these gains were short-lived, and the SDX reversed as the U.S. Dollar remained under pressure before rebounding on the final trading day of the month. The SDX closed March at 103.92, marking a monthly loss of 3.09%, the worst monthly performance in over 2 years, reflecting continued bearish sentiment driven by global economic concerns and subdued demand for the U.S. Dollar.
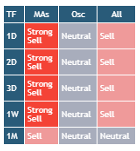
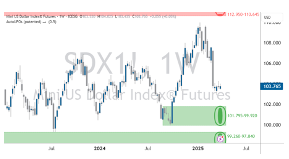
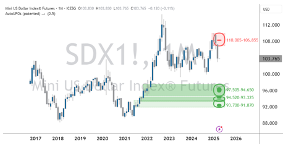
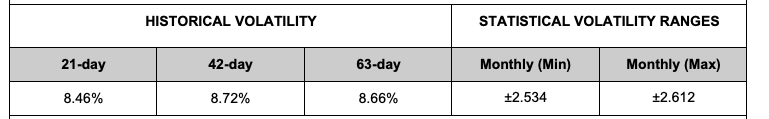
Daily technical indicators of SDX prices indicated a strong sell overall based on the moving averages. The technical oscillators indicated generally neutral conditions, which could prompt investors to consider waiting for a pullback before seeking trading opportunities. Using historical volatility, the price from the prior month’s close could range between 106.38 to 101.15 within the next 30 days. Investors or traders may consider the weekly support (101.80 to 99.92) or resistance areas (112.95 to 110.64) when planning their entries or exits, depending on their trading strategies. In March, the SDX was in a downtrend in the weekly and daily timeframes.
Source: TradingView | Events Source: FXStreet | Conditions Table: using daily SMA (10, 20, 30,50, 100, 200), EMA (10, 20, 30,50, 100, 200), Ichimoku Cloud (9, 26, 52), VWMA (20), HullMA (9), RSI (14), Stochastic (14, 3, 3), CCI (20), ADX (14, 14), Awesome Oscillator, Momentum (10), MACD (12, 26, 9), Stochastic RSI (3, 3, 14, 14), Williams %R (14), Bulls and Bears Power and Ultimate Oscillator (7,14,28) | Statistical Ranges: projecting daily Historical Volatility (21, 42, 63) | Support & Resistance Levels: using AutoUFOs® (0.5) applied to daily, weekly and monthly
timeframes (plotted as dotted lines that represent relevant support and resistance price zones colored as follows: red = resistance levels & green = support levels)
MINI BRENT CRUDE FUTURES
SYMBOL: BM
CONDITIONS
UPCOMING HIGH IMPACT EVENTS:
- Sat 5 April OPEC+ 59th Joint Ministerial Monitoring Committee Meeting (JMMC).
- Wed 28 May The 39th OPEC and non-OPEC Ministerial Meeting (ONOMM)
MARKET COMMENTARY
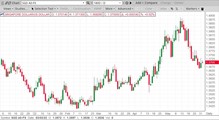
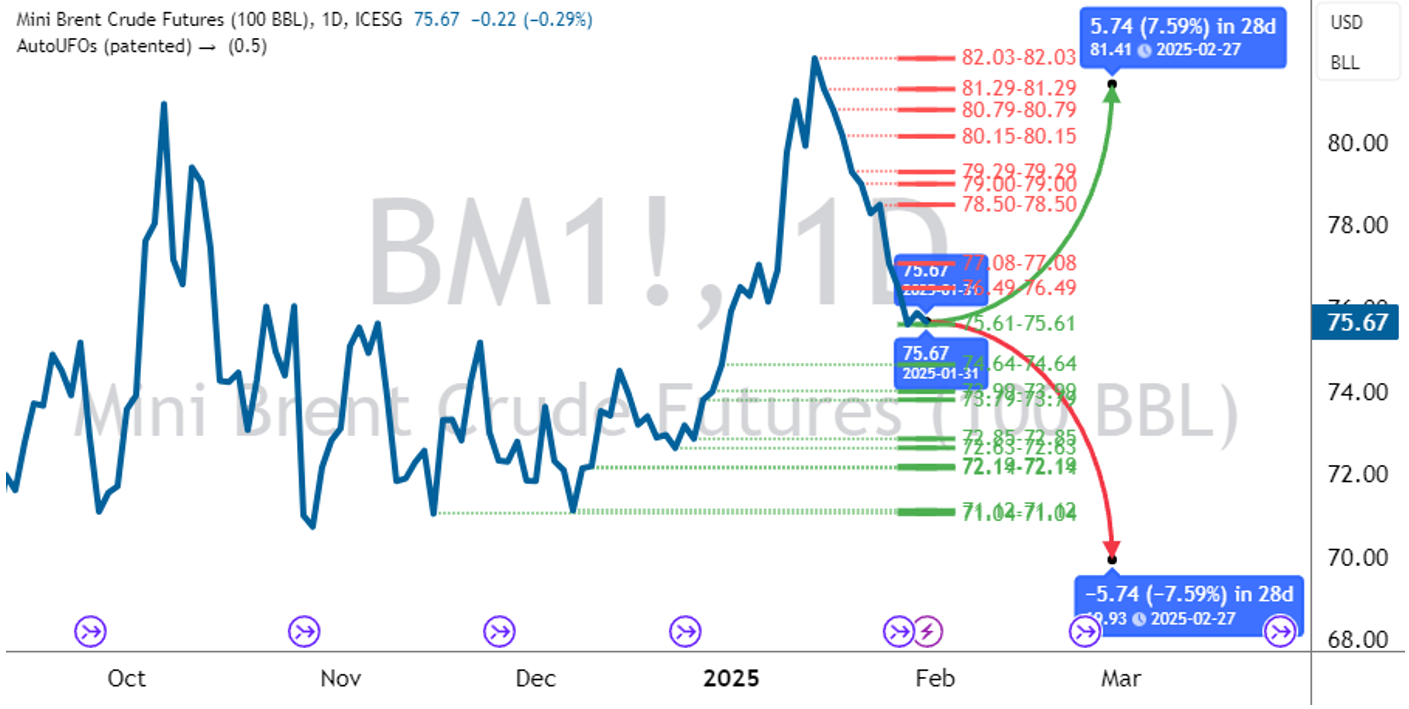
Throughout the month, Mini Brent Crude futures (BM) twice found support above the $69 level before steadily climbing back to $74. Ultimately, price closed at $74.77, marking a 2.7% increase from the previous month's close.
U.S. President Donald Trump issued a warning about "secondary tariffs" on countries purchasing oil from Russia and Venezuela, particularly targeting buyers like China. This aggressive trade stance sparked fears of supply disruptions, injecting uncertainty into the markets and adding upward pressure to prices.
Meanwhile, the OPEC+ alliance, which includes major producers such as Saudi Arabia, Russia, Iraq, and the United Arab Emirates, continued navigating a delicate balancing act. In March, they reaffirmed their commitment to stabilizing the market through controlled output, even as the global economy showed signs of both recovery and fragility. However, starting April 1st, OPEC+ initiated a phased rollback of their previous 2.2 million barrels per day cut, increasing output by 138,000 barrels per day each month, aiming for full restoration by September 2026. This decision, led by optimism in demand recovery, particularly from Asia, also underscored their readiness to adjust if market conditions shift.
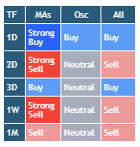
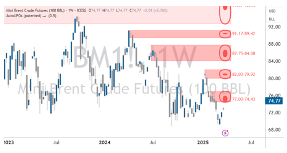
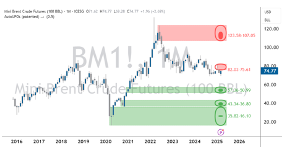
Daily technical indicators of oil futures (BM) prices indicated mixed buying market conditions. Technical oscillators in the prior month pointed toward neutral to buying market conditions. Using historical volatility, the price from the prior month’s close could range between $69.19 and $80.35 ($11.11) in the next 31 days. Investors or traders could consider daily support ($69.28 to $72.16) or weekly resistance ($74.43 to $77.00) areas when planning their entries or exits based on their trading strategies. Daily chart prices were sideward, holding between $69 and $82.
Source: TradingView | Events Source: FXStreet | Conditions Table: using daily SMA (10, 20, 30,50, 100, 200), EMA (10, 20, 30,50, 100, 200), Ichimoku Cloud (9, 26, 52), VWMA (20), HullMA (9), RSI (14), Stochastic (14, 3, 3), CCI (20), ADX (14, 14), Awesome Oscillator, Momentum (10), MACD (12, 26, 9), Stochastic RSI (3, 3, 14, 14), Williams %R (14), Bulls and Bears Power and Ultimate Oscillator (7,14,28) | Statistical Ranges: projecting daily Historical Volatility (21, 42, 63) | Support & Resistance Levels: using AutoUFOs® (0.5) applied to daily, weekly and monthly timeframes (plotted as dotted lines that represent relevant support and resistance price zones colored as follows: red = resistance levels & green = support levels)
MICRO COINDESK BITCOIN FUTURES
SYMBOL: MCB
CONDITIONS:
UPCOMING HIGH IMPACT EVENTS:
- 2028 Bitcoin Halving event
MARKET COMMENTARY
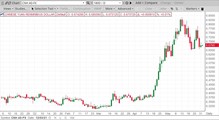
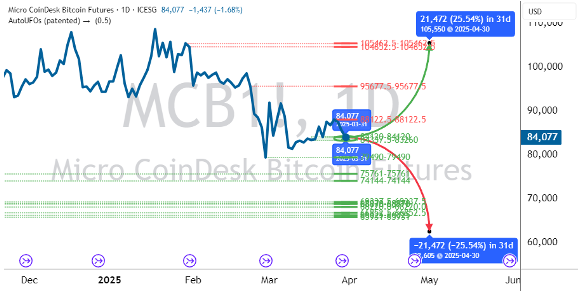
Micro Coindesk Bitcoin futures (MCB) briefly climbed to $92,000 in the first week of the month after slipping below the former $93,000 support level, which had turned into resistance. The price later retreated toward $80,000, ending the month at $84,077- up 5.8%. Risk-based assets continued to reflect the economic uncertainty carried over from the previous month.
Amid persistent market uncertainty, a number of spot-bitcoin exchange-traded funds (ETFs) were introduced. Leading the wave was BlackRock’s iShares Bitcoin ETP (exchange-traded product) (IB1T), which made its debut on major European exchanges, including those in Paris, Amsterdam, and Frankfurt. Also noteworthy was the launch of a distinctive series of Calamos principal-protected bitcoin ETFs and the Calamos Bitcoin 80 Series Structured Alt Protection ETF® – April (CBTA). Designed with capital preservation in mind, these products cater to risk-conscious investors and underscore the growing sophistication and mainstream accessibility of crypto-related financial instruments.
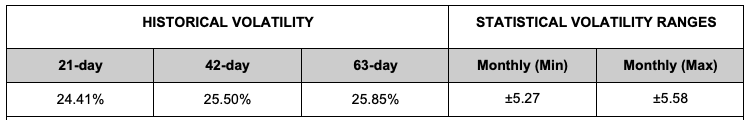
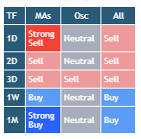
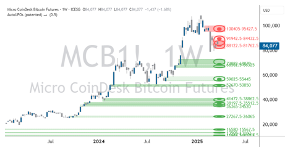
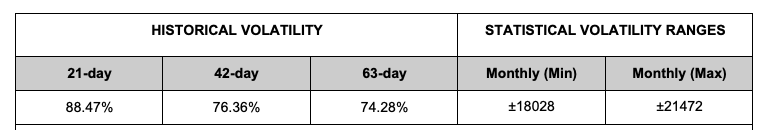
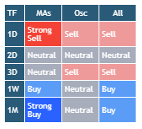
Daily technical indicators of MCB prices indicated strong selling price action for daily and weekly moving averages. The technical oscillators indicated neutral to weak market conditions. Using historical volatility, the price from the prior month’s close could range between $62,605 and $105,550 ($42,945) in the next 31 days. Investors or traders could consider the weekly support ($68,870 to $73,083) or weekly resistance ($81,763 to $88,113) areas when planning their entries or exits based on their trading strategies.
Source: TradingView | Events Source: FXStreet | Conditions Table: using daily SMA (10, 20, 30,50, 100, 200), EMA (10, 20, 30,50, 100, 200), Ichimoku Cloud (9, 26, 52), VWMA (20), HullMA (9), RSI (14), Stochastic (14, 3, 3), CCI (20), ADX (14, 14), Awesome Oscillator, Momentum (10), MACD (12, 26, 9), Stochastic RSI (3, 3, 14, 14), Williams %R (14), Bulls and Bears Power and Ultimate Oscillator (7,14,28) | Statistical Ranges: projecting daily Historical Volatility (21, 42, 63) | Support & Resistance Levels: using AutoUFOs® (0.5) applied to daily, weekly and monthly timeframes (plotted as dotted lines that represent relevant support and resistance price zones colored as follows: red = resistance levels & green = support levels)
MICRO ASIA TECH 30 INDEX FUTURES
SYMBOL: ATI
CONDITIONS
UPCOMING HIGH IMPACT EVENTS:
Interest Rates
- Tue 1 Apr RBA
- Thr 17 Apr BOK
- Mon 21 Apr PBOC
- Thr 1 May BOJ
Consumer Price Index
- Thr 10 Apr China
- Thr 17 Apr Japan
- Wed 30 Apr Australia
MARKET COMMENTARY
ATI reversed its February gains, closing at $4,251, reflecting a 4.6% decline from the previous month. Technology stocks globally faced price losses in the first quarter, as investors took profits amid continued uncertainty following President Trump’s tariff announcements.
Taiwanese stocks struggled across the board. ASE Technology and Hon Hai posted steep drops of 16.40% and 16.10%, respectively. TSMC fell 12.50% amid concerns over global chip orders, while Delta, Quanta, and MediaTek also declined between 8% and 10%, capping off a difficult month for the sector.
Japanese stocks were broadly negative. Only Fujitsu and Sony posted gains, rising 2.50% and 0.70% respectively, supported by stable earnings in IT and entertainment. The rest of the segment declined sharply, with DISCO and Advantest down more than 20%, and Renesas losing 19.40%, highlighting pressure on the chip equipment space. Other notable names such as Keyence, Lasertec, Murata, Canon, Nintendo, and Tokyo Electron also recorded losses ranging from 5% to 10%, as global demand concerns weighed heavily.
Chinese stocks showed relative strength this month. Kuaishou led with a solid 7.40% gain, while Baidu advanced 7.70% on optimism around its AI developments. NetEase rose 2.10%, and both Alibaba and JD.com saw slight gains of 0.40% and 0.10%, respectively. Meanwhile, Xiaomi fell 5.10% and Meituan declined 3.80%, possibly due to concerns over domestic consumer demand.
Performance in Korean stocks was mixed. Samsung Electronics gained 6.10% amid signs of recovery in chip demand, while SK Hynix edged up 0.30%. In contrast, LG Energy Solution dropped 5.00%, potentially reflecting reduced investor appetite for EV-related stocks.
In Australia, Wisetech Global experienced a sharp 9.20% decline, reflecting weaker sentiment around tech logistics as investor caution grew.
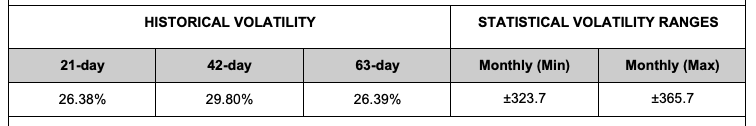
Daily and weekly moving average technical indicators of ATI prices indicated neutral and selling market conditions during the month. Technical oscillators indicated weak to neutral market conditions last month. Using historical volatility, the price from the prior month’s close could range between $3,886 and $4,617 ($731) in the next 31 days. Investors or traders could consider weekly support ($4,126 to $4,287) or weekly resistance ($4,503 to $4,592) areas when planning their entries or exits based on their trading strategies.
Index Composition: 31.9% Taiwan, 26.9% Japan, 26.5% China, 14.2% South Korea, 0.5% Australia
Source: TradingView | Events Source: FXStreet | Conditions Table: using daily SMA (10, 20, 30,50, 100, 200), EMA (10, 20, 30,50, 100, 200), Ichimoku Cloud (9, 26, 52), VWMA (20), HullMA (9), RSI (14), Stochastic (14, 3, 3), CCI (20), ADX (14, 14), Awesome Oscillator, Momentum (10), MACD (12, 26, 9), Stochastic RSI (3, 3, 14, 14), Williams %R (14), Bulls and Bears Power and Ultimate Oscillator (7,14,28) | Statistical Ranges: projecting daily Historical Volatility (21, 42, 63) | Support & Resistance Levels: using AutoUFOs® (0.5) applied to daily, weekly and monthly timeframes (plotted as dotted lines that represent relevant support and resistance price zones colored as follows: red = resistance levels & green = support levels)
PRODUCT HIGHLIGHT:
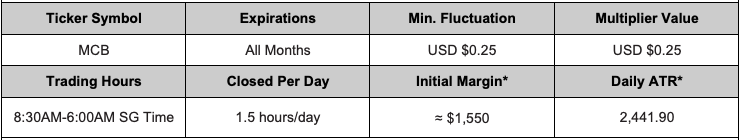
Micro CoinDesk Bitcoin Futures contract with contract size of 0.1 Bitcoin is cash-settled with the spot price of bitcoin referenced against CoinDesk’s Bitcoin Price Index. The reduced product size allows clients to optimize their capital exposure allocation and flexibility to utilize financial leverage across multiple products giving portfolio diversification opportunities to the client.
Source: TradingView | Average True Range: using daily ATR (14) | Support & Resistance Levels: using AutoUFOs® (0.5) applied to daily and weekly timeframes
(plotted as dotted lines that represent relevant support and resistance price zones colored as follows: red = resistance levels & green = support levels)
CONTRACT SPECIFICATIONS
Do you have any questions or need further details?
Risk Considerations for Retail Investors or Users
Futures contracts based on bitcoin may pose specific risks. Such risks may arise from greater volatility in prices resulting from a range of factors. Those risks could in turn affect financial outcomes associated with maintaining required margins or any losses at final contract settlement. Accordingly, such products may not be suitable for a retail investor or user, and such person may wish to approach their broker to assess his/her suitability to transact in the product.
Restrictions on Distribution
The distribution of this document and the offering of any products, investments or strategies mentioned in it may be restricted by law in certain jurisdictions. None of ICE Futures Singapore, Intercontinental Exchange Inc. nor any of their affiliates (collectively, “ICE”) represent that this document may be lawfully distributed, or that any product, investment or strategy described in it may be lawfully offered in compliance with any applicable laws or requirements in any such jurisdiction.
Disclosure Section
This document does not provide individually tailored financial or investment advice, and no part of this document should be construed as doing so. This document has been prepared without regard to the individual financial or other circumstances and objectives of persons who receive it. Investors and users should independently evaluate particular products, investments, and strategies and are encouraged to seek the advice of a financial advisor. The appropriateness of a particular product, investment or strategy will depend on a user or investor's individual circumstances and objectives. The products, investments or strategies discussed in this document may not be suitable for all users and investors, and certain users or investors may not be eligible to purchase or participate in some or all of them.
ICE Futures Singapore does not provide financial, investment, legal or tax advice and is not in the business of doing so. Each user or investor should always consult a financial, investment, legal or tax advisor for information concerning its individual situation and to learn about any potential financial, investment, legal, tax or other implications that may result from any product, investment or strategy described in this document.
In particular, any opinion contained in this document (including an indication of any “sell”, “neutral” or “buy” condition) is generic and not a recommendation to take (or omit to take) any action in relation to any product, investment or strategy.
Key Information Documents for certain products covered by the EU Packaged Retail and Insurance-based Investment Products Regulation can be accessed on the relevant exchange website under the heading “Key information Documents (KIDS)”.
© 2025 Intercontinental Exchange, Inc. The information and materials contained in this document - including text, graphics, links or other items - are provided for general information only on an "as is" and "as available" basis. Although this document is issued in good faith, no representation, warranty or guarantee, whether express or implied, is or will be made in respect of the information contained herein. ICE excludes all liability arising from or in relation to the accuracy, adequacy, completeness, fitness or timeliness of the information provided and assumes no duty whatsoever. The information in this document is liable to change, and ICE undertakes no duty to update such information. You should not rely on any information contained in this document without first checking that it is correct and up to date. No information set out or referred to in this document shall form the basis of any contract. The content of this document is proprietary to ICE in every respect and is protected by copyright. No part of this material may be copied, photocopied or duplicated in any form by any means or redistributed without the prior written consent of ICE. All third-party trademarks are owned by their respective owners and are used with permission.
Trademarks of ICE and/or its affiliates include Intercontinental Exchange, ICE, ICE block design, NYSE, and New York Stock Exchange. Information regarding additional trademarks and intellectual property rights of Intercontinental Exchange, Inc. and/or its affiliates is located at www.intercontinentalexchange.com/terms-of-use
The contracts are not sponsored, endorsed, sold or promoted by MSCI Inc. (“MSCI”), any affiliate of MSCI or any other party involved in, or related to, making or compiling the MSCI Europe Index. The contracts have not been passed on by MSCI, any of its affiliates or any other party involved in, or related to, making or compiling the MSCI Europe Index as to their legality or suitability with respect to any person or entity. MSCI, its affiliates and any other party involved in, or related to, making or compiling the MSCI Europe Index do not guarantee the originality, accuracy and/or completeness of the MSCI Europe Index or any data included therein. Neither MSCI, any of its affiliates nor any other party involved in, or related to, making or compiling the MSCI Europe Index makes any express or implied warranties, and expressly disclaims all warranties of merchantability of and fitness for a particular purpose or use with respect to the contract, the MSCI Europe Index or any data included therein. Without limiting any of the foregoing, in no event shall MSCI, any of its affiliates or any other party involved in, or related to, making or compiling the MSCI Europe Index have any liability for any direct, special, punitive, indirect or consequential damages (including lost profits), even if notified of the possibility of such damages, claims, losses or expenses relating to any futures or options contracts or caused by any errors or delaying in calculating or disseminating the MSCI Europe Index. Neither MSCI, any of its affiliates nor any other party involved in, or related to, making or compiling the MSCI Europe Index has any obligation to take the needs of the issuers of the contracts, the owners of the contracts of the Exchange into consideration in determining, composing or calculating the MSCI Europe Index. Neither MSCI, its affiliates nor any other party involved in, or related to, making or compiling the MSCI Europe Index is responsible for or have participated in the determination of the timing of, prices at, or quantities of the contracts to be issued or in the determination or calculation of the equation by which the contracts are redeemable for cash.